
Research answer
What AppTrendKit can say about SPL Graph today
SPL Graph has no estimate-backed download or gross-consumer-spend figure that meets the public evidence contract yet.
Observed App Store metadata, chart positions, and history are shown below. Missing, non-finite, undefined-currency, or undefined-metric evidence stays missing rather than becoming zero.
Performance
Downloads, revenue and chart history
Estimates for the last 7D. Chart positions come from the App Store; downloads and revenue are AppTrendKit estimates, shown as a size band (for example 10K–50K) with a confidence level.
Estimated downloads · 30D
Upper limitUnder 10K
Below the top 100 in Music (US)
The app is not in its category's top 100, so it has less than the app ranked #100 there. We show this limit until we have enough data for an estimate.
Estimated App Store gross consumer spend · 30D
Upper limitUnder $200K
Below the top 100 in Music (US)
The app is not in its category's top 100, so it has less than the app ranked #100 there. We show this limit until we have enough data for an estimate.
History
Collected daily performance
No daily history yet.
Rank history
Chart positions
Lower rank is better. Only collected observations are shown.
Coverage note
What the ranks mean
A missing rank is not treated as zero downloads or zero revenue. Apple chart feeds are bounded and may return censored or not-ranked observations outside the visible chart depth.
Read the methodStorefront mix
Top countries by estimated contribution · 7D
Country figures cover the days we collected in each country, so they don't add up to the worldwide estimate. Each country shows when it was last updated.
Monetization
How the app makes money
These are listing and product observations. They are not company revenue, subscriber counts, or advertising revenue.
App details
Store metadata
- Version
- 9.2
- Released
- Mar 27, 2009
- Last updated
- Sep 16, 2026
- Content rating
- 4+
- Default storefront
- US
Public IAP observations
Validated in-app purchase prices
Only persisted rows with an explicit public publication boundary are shown. Missing price, currency, country, or date values stay unknown.
Listing detail
What the store says
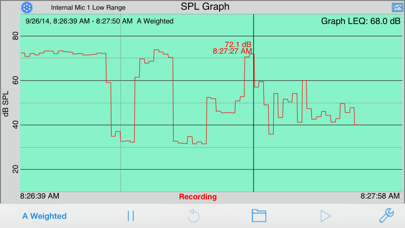
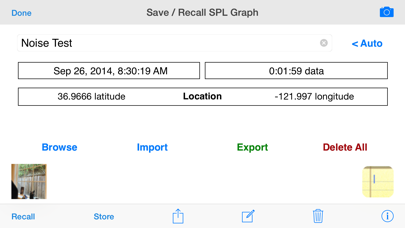
SPL Graph is an audio Sound Pressure Level (SPL) environmental noise analyzer, real-time frequency analyzer, chart recorder and data logger. It includes: * Plot sound level over time * Record audio while plot is running, playback to identify sounds that may have caused problems * Capture video of events (optional in-app purchase) * Do octave and 1/3 octave band analysis (optional in-app purchase) * Show a 3D Plot of octave or 1/3 octave results * Calculate Ln SPL values, L01, L10, L50, L90, L95, LMax and LMin * Email notifications when sound exceeds pre-set limits * Auto-save results after set intervals, and email the results to you * Start another plot after auto-saving for continuous operation SPL Graph works by averaging the SPL for a period of time that can vary from 0.1 second to 60 minutes, applying an optional weighting filter, and plotting the sound level, recording the raw audio signal, if recording is turned on. For sound intervals of 1.0 second to 60 minutes, the optional octave and 1/3 octave logging modules allows storing the spectrum of the sound, for each interval. The app works very well with the built-in iOS device microphone. To upgrade the app to true professional standards, add our iTestMic, iPrecisionMic, or iAudioInterface2 with an appropriate microphone, and get ANSI or ISO Type 1 or 2 results. With iPrecisionMic, you can send the system in to our calibration lab and get a calibration certificate for ISO 61672 and ANSI S1.4. SPL Graph can record up to 24 hours of sound level data, with single second resolution. The graph starts with a one-minute plot window, and as a minute is recorded, the graph re-scales automatically and adds another minute to show the data collected so far. The overall SPL level, or LEQ, is displayed for whatever portion of the test is showing on the graph. Tap the play button to play back the recorded audio, and you can use the cursor to scrub the audio location on the graph. Use this feature to listen to events that you can see on the graph. With the optional octave logging module, you can also record the octave or 1/3 octave band levels. And, you can view the data on the 3D plot for a graphical view of frequency over time. You can scroll and scale the graph vertically, in dB, by using standard swipe and pinch gestures. You can also scroll and expand and contract the time axis using gestures. Zoom out to a full 24 hours, or zoom in to a single minute, showing second resolution. Double-tap the screen to zoom out to show the entire graph on the screen. The time scale grid changes dynamically, highlighting minutes, ten-minute, and hour lines as as it runs. As the graph runs, the overall LEQ (average SPL) for the entire time period is computed and displayed on the screen. Swiping across the graph brings up a cursor that displays the exact dB level and time for any point on the graph. You can turn on audio recording, so that you have a record of the sounds that were happening while the graph was being stored. You can use this to figure out exactly what the sound was that caused a peak on the graph, for example. Recordings can be compressed or uncompressed. If you exit the app, or are interrupted with a phone call, the graph data will not be lost. SPL Graph will automatically save the graph, and reload it when you next open the program. You can also save a graph in one of ten files on the iPhone, so that you can recall the graph later. SPL Graph supports saving graphs directly on your iOS device. You can recall these graphs and bring them up on the screen, and listen to the sounds that were made while the graph was recorded. You can also store an image of the screen to your photo roll. Use Dropbox or iTunes Files Sharing to export the results to your computer. You can also export data in tab-delimited files for XLS import using iCloud. The filters are all ANSI type 1 or better, and include A-weighting, C-weighting, and all octaves band filters from 32 to 16kHz.
Publisher websiteStore creative
Screenshots


Competitive set
Similar apps
Deterministic links to real stored apps matched by category, publisher, and comparable performance bands.

SPL
Andrew Smith

SPL Meter
Andrew Smith

AudioTools, dB, Sound & Audio
Andrew Smith

Spotify: Music and Podcasts
Spotify

Pandora: Music & Podcasts
Pandora Media, LLC

Amazon Music: Songs & Podcasts
AMZN Mobile LLC

Apple Music
Apple Canada, Inc.

SiriusXM: Music, Sports & News
Sirius XM Radio, LLC
How we estimate
Where every number comes from
App details: Apple iTunes Search API, updated Sep 27, 2026, 9:15 PM.
Rankings: collected chart positions from the listed storefront. Missing ranks are not zeros.
Economics: downloads and gross store consumer spend are estimated, not official Apple or publisher figures.
Model: Lineage not exposed by this aggregate.
Confidence: —; intervals widen when evidence or history is limited.
Last updated: Sep 27, 2026, 9:15 PM.
See how AppTrendKit separates observations, estimates, coverage, and confidence.
Open methodology